Table of contents
<aside> 📱 Some of the apps developed by Fuller include an SDK that collects the user's terminal information and the actual usage data (launch information, etc.) of the application being used in the terminal.
</aside>
App Ape provides data called application User Activity. App usage information is the number of installed applications of the various application using the three data surveyed and referenced by Fuller; in addition to the data of panel users, the number of application users such as active users, sex ratio, and age ratio is an estimate of how apps are being used.
Usage trend of demographics and sex & age statistic surveyed through the usage of smartphone etc.

Collaborated companies that assist with App Ape's data quality

Smartphone usage data from panels
(App Analysis › User Activity)
Usage information of app analysis function per country is as the following.
Countries where data are shown :
(App analysis › User Activity)
The data of app analysis is as follows. The following data are all estimated values.
| Index | Description |
|---|---|
| Monthly Active User (MAU) | Number of users who launched an app with a given month |
| Weekly Active User (WAU) | Number of users who launched an app in a given week (Mon-Sun) |
| Daily Active User (DAU) | number of users who launched an app in a given day |
| Demographics (Sex & Age) | Sex / Age ratio of the app users |
| Usage Frequency | Percentage of Light User, Middle User, Heavy User |
| Cross-App Usage | Apps that users of the target app use simultaneously. |
| User Status Demographics | Sex & Age ratio of the light, middle, and heavy users |
| Time Spent | Time spent on apps in a given month |
| Hourly Active User(HAU) | Number of users who launched an app at least once during the applicable time period (hour) |
| App Activation Count | Number of times a user launches an app on average in a day |
| New Users | Number of new users of the subject app during the target period |
| Active Installs | Number of users who have an app installed on their device during a given period |
| Active Rate | Ratio of users using an app to the number of users who have the app installed during a given period |
| Ranking history | Ranking history of several metrics mentioned above |
<aside> 📘 ※ Missing data means that the corresponding data does not exist, or the numerical value could not be calculated.
※ Due to rounding of the results displayed data may not be the exact figure as obtained from possession ratio multiplied by the population number.
※ The above data is obtained by adjusting for the distribution of panel users and the smartphone penetration rate as well as a weighted sampling factor.
※ Gener data is obtained through user input as well as App Ape estimates.
※ You can access data obtained since June 2016 through the dashboard. However, Time Spent can access after January 2019, and New Users, Active Installs, Active Rate can access after January 2021, and Cross-App Usage can access after January 2024.
</aside>
(App Analysis › User Activity › [App Name])

App Analysis › Usage Details (1/3)

App Analysis › Usage Details (2/3)

App Analysis › Usage Details (3/3)
(App Analysis › User Activity › Target App Name › Android+iOS)
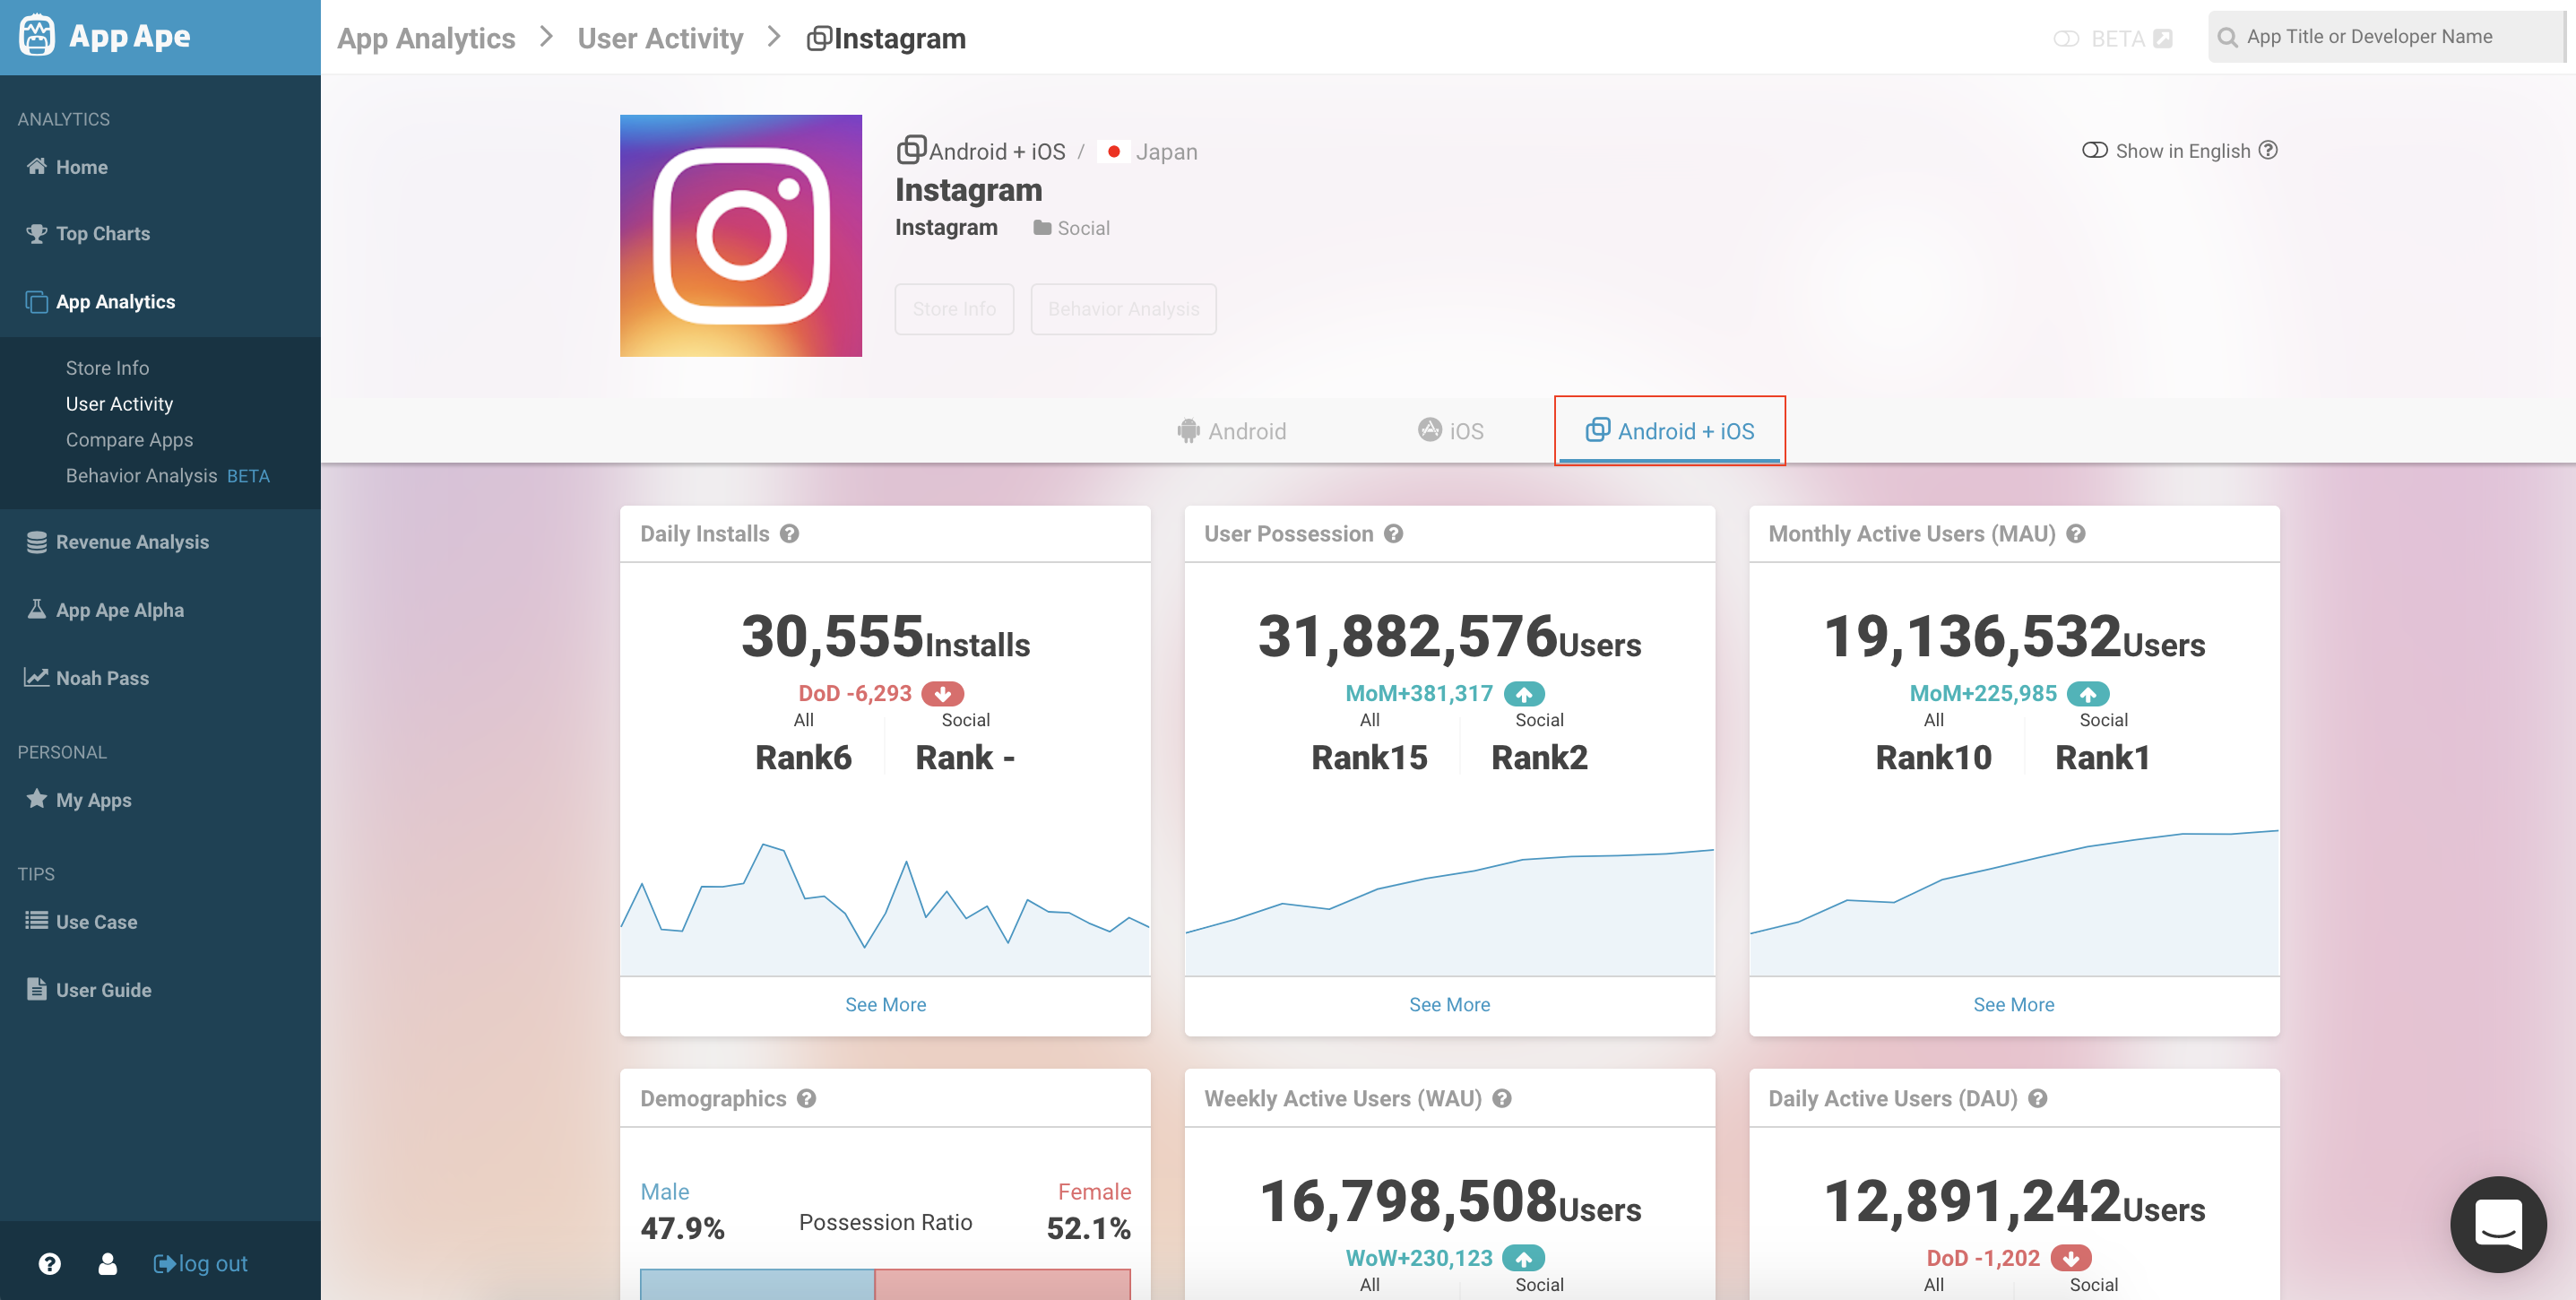
On the User Activity page, both Android and iOS platform data are combined and displayed. What data is available is listed below.
※ Note: The combined platform data is available only if the selected application's Android and iOS data is visible on App Ape.
(App Analysis › User Activity › Targeted App Name › Monthly Active Users (MAU))