Table of contents
<aside> 📅 Retention analysis gives insight into the number of new users who continue to use your app over a certain period of time.
Using App Ape Retention you can:
※ Available for Android only
</aside>
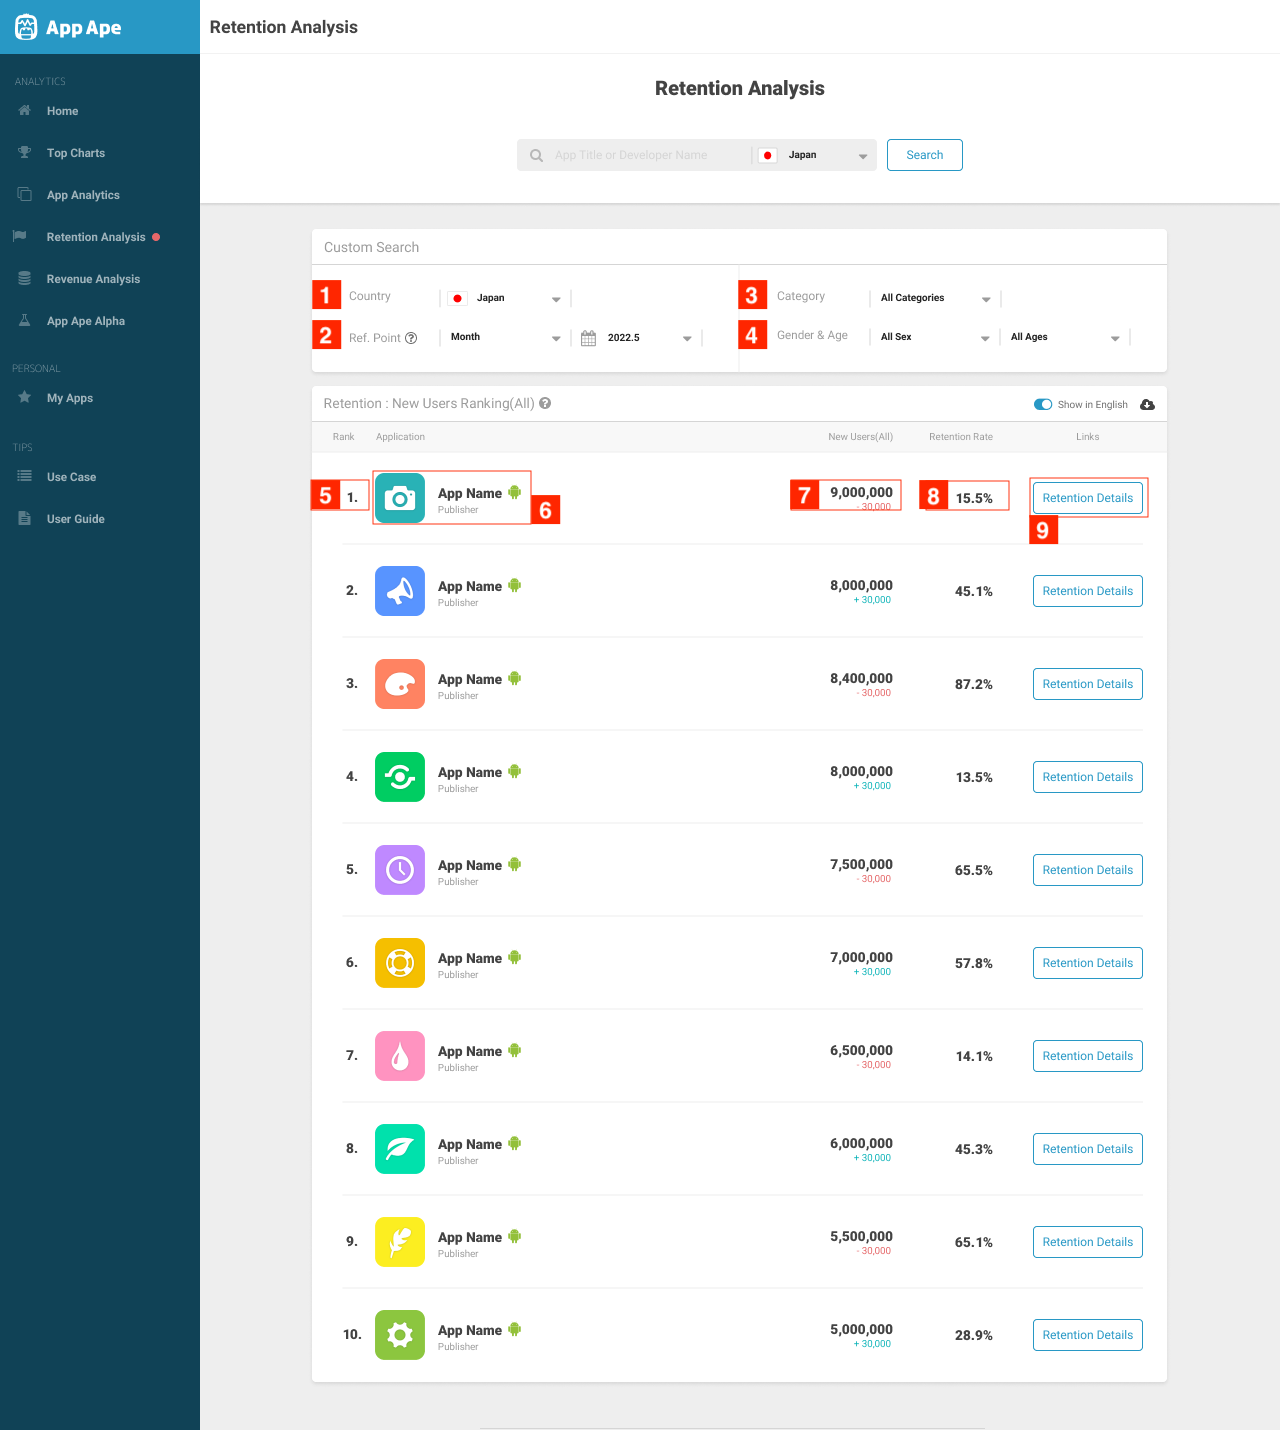
Allows users to select and change search conditions.
Available data based on country:
Displays the number of new users of apps in the selected "reference date" and retention rate for the following month. Also available by sex and age groups.
Available for Google Play Store categories
Allows you to filter data based on user sex and age.
App rankings are displayed in descending order based on "number of new users" for the selected time period. Available for the top 500 apps. Ranking can also be displayed based on user sex and age groups.
Basic app information (app name, icon).
The number of new users in the selected time period. Also available for user sex and age groups.
Retention rate* of new users during the selected time period is. Also available for user sex and age groups.
※ The next month's retention rate for the selected time period
Clicking on Details takes you to another page containing more information on the selected app and search conditions.
<aside> 📘 ※ Missing data may be due to numbers and values not meeting certain requirements needed to perform calculations. Such data will be displayed when requirements are met as a result of technical improvements.
※ Due to rounding errors, estimated values may not match the multiplication of ratio and user population.
※ The above data is calculated after having matched panel users with smartphone users distribution (in Japan) and multiplying a weight variable.
※ Currently, Retention data since January 2021 are available on the dashboard.
</aside>
Next Article Retention | Detail →