Table of contents
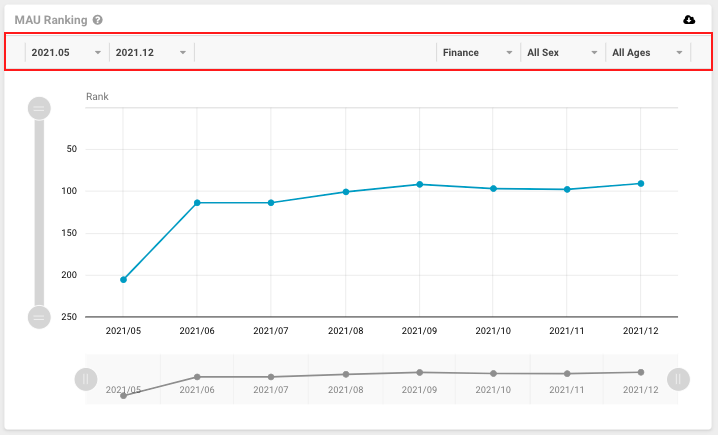
Various parameters can be changed from the graph parameter change section. Setting parameters will display data in more detailed.
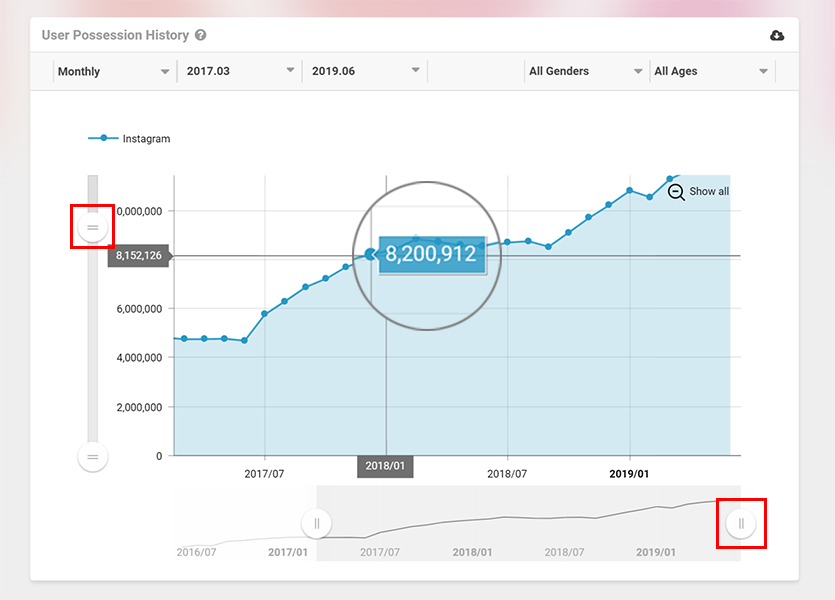
You can adjust the display area by dragging the slider at the side and bottom of the graph. Also, by mousing over the graph a balloon will display.
Next Article Switching OS and data →